


Quick Overview Of Social Media Return On Investment
Measuring ROI on channels like Facebook, Instagram, and LinkedIn is about more than just numbers. It’s how you prove that every dollar spent—and every late-night post—is actually driving value. When you line up revenue against spend, you get a clear picture of campaign efficiency.
Here’s a simple roadmap to get started:
- Clarify what you want from social efforts—awareness, leads, or sales.
- Choose an attribution model that mirrors your customer journey.
- Track KPIs such as cost per acquisition, customer lifetime value, and engagement rate.
- Plug real campaign numbers into our formulas for hands-on practice.
- Harness platforms like PostSyncer to bring all analytics under one roof.
- Test tactics and refine over time to squeeze out better returns.

In the pages ahead, we’ll walk you through every milestone—from sketching out crisp targets to feeding numbers into a live dashboard. You’ll discover how marketers use ROI as a north star to shift budgets and tweak ads for better impact. We’re not stopping at theory; you’ll get hands-on templates and PostSyncer workflows to simplify each step.
Key ROI Metrics Summary
Before we dive deeper, here’s a snapshot of the core metrics, their formulas, and why they matter:
| Metric | Formula | Purpose |
|---|---|---|
| Return on Investment | (Revenue − Cost) ÷ Cost | Measure overall efficiency of social spend |
| Return on Ad Spend (ROAS) | Revenue ÷ Ad Spend | Evaluate effectiveness of ad dollars |
| Cost per Acquisition (CPA) | Total Cost ÷ Conversions | Assess how much each conversion costs |
| Customer Lifetime Value (CLV) | Average Value × Purchase Frequency | Estimate long-term revenue per customer |
Keep this chart handy as we explore each metric in depth.
Check out our guide on measuring social media performance in How to Measure Social Media Success.
Understanding Social Media ROI Concepts
Imagine your marketing budget as a garden: every post, ad, or campaign is a seed you plant. With careful tending—smart audience targeting, eye-catching content, and steady interaction—those seeds become clicks, conversions, and earned media value.
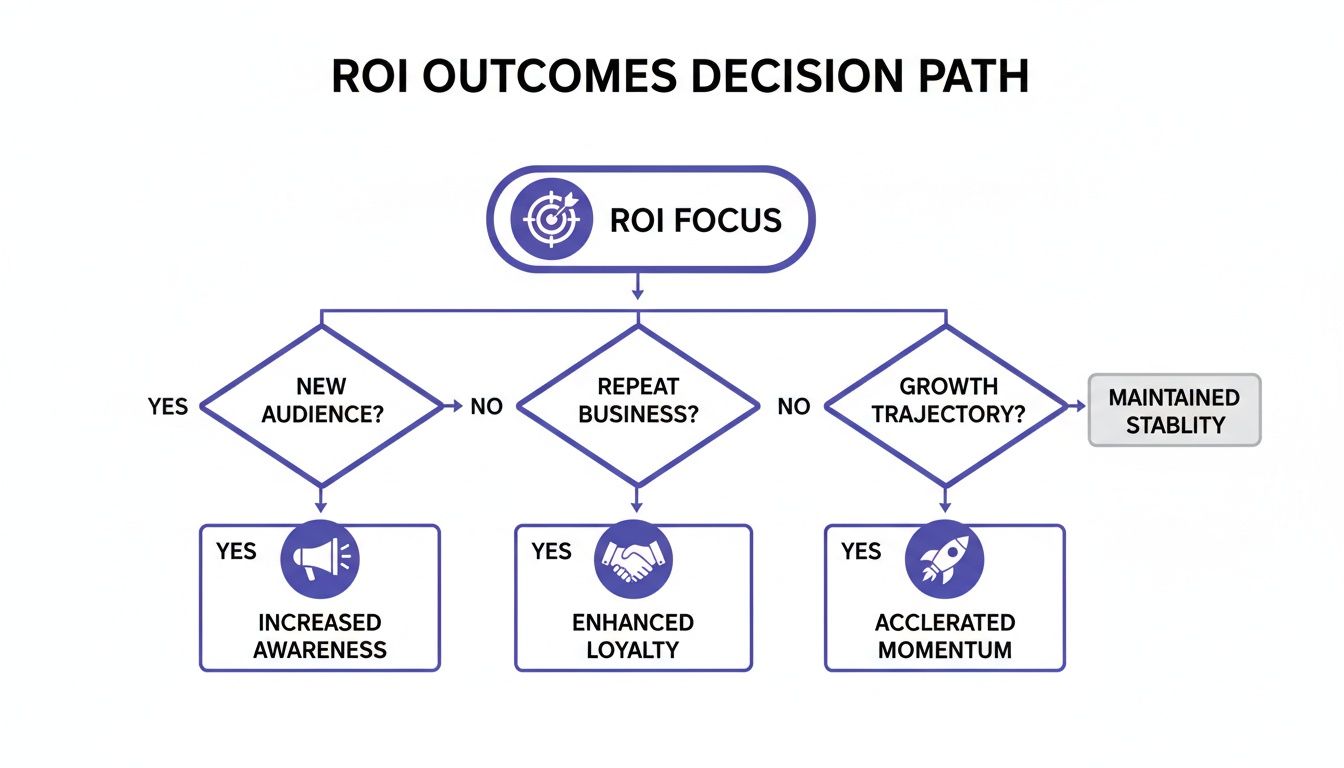
But ROI isn’t just dollars in versus dollars out. It’s also brand awareness, audience loyalty, and the momentum that fuels your next growth cycle. Think of it as a living ecosystem, where each touchpoint contributes to measurable progress.
Key Components Of Social Media ROI
Before you crunch numbers, get clear on these core metrics:
Engagement Rate
Tracks likes, comments, and shares against your total audience.Sentiment Analysis
Monitors positive, neutral, and negative mentions to gauge perception shifts.Customer Lifetime Value (CLV)
Estimates the average revenue generated by a social-media–acquired customer over time.
These figures let you assign value to both direct wins (sales, sign-ups) and indirect gains (brand lift, word of mouth).
Quick Insight Assigning a dollar value to engagement actions bridges qualitative efforts to ROI metrics.
Learn how shares and mentions translate into value in our article Earned Media Value.
Seeing ROI As An Ecosystem
Treat each campaign like a plant in your garden—everything’s connected:
Root Watering
Paid ads deliver immediate conversions, feeding revenue at the base.Fertilizer Application
Organic interactions—comments, saves, tags—nurture loyalty over time.Seed Spreading
Shares and referrals broadcast your story to new audiences.
Mapping these stages clarifies attribution when multiple touchpoints overlap.
Measuring Intangible Benefits
Not all returns show up on a ledger. Brand awareness and sentiment lift lay the groundwork for future growth.
Monitoring these signals prevents undervaluing the trust and credibility you build over time.
Key Takeaway Blending direct revenue with brand-lift scores gives you a fuller picture of social media ROI.
| Benefit Type | Metric Examples | Impact on ROI |
|---|---|---|
| Direct Revenue | Conversions, Sales | Immediate ROI boost |
| Indirect Growth | Impressions, Sentiment, Shares | Long-term value accumulation |
Tools like PostSyncer pull all these data points into a single dashboard. You can even set up automated alerts for sudden spikes or dips—so you never miss a critical trend.
Next Steps For A Thriving ROI
- Define clear ROI objectives that tie back to your business goals.
- Schedule regular check-ins to review both quantitative and qualitative metrics.
- Adjust your strategy based on real-time feedback and performance data.
By treating ROI as a dynamic ecosystem, you’ll turn every social media effort into a genuine cycle of growth.
Calculating ROI With Attribution Models
When your social campaigns overlap across channels, figuring out which dollar drove which result can feel like juggling. At its core, ROI is simply (Revenue – Cost) ÷ Cost. Yet assigning credit fairly means choosing an attribution model that mirrors your customers’ actual path.
- First Click credits the very first touchpoint that sparks awareness.
- Last Click gives full credit to the final interaction before conversion.
- Linear spreads the value evenly across every step in the journey.
- Time Decay weights later touchpoints more heavily, reflecting rising purchase intent.
Choosing Between Models
Every attribution model serves a different purpose. If you care most about how people discover your brand, first click shows you which campaigns planted the seed. On the flip side, last click is like applauding the guide who led the traveler across the finish line.
Key Insight Align your attribution model with the stage you value most—whether that’s broad awareness or the moment someone makes a purchase.
Attribution Model Comparison
Below is a quick comparison of common attribution models and how they allocate credit across social touchpoints.
| Model | Credit Allocation | Best Use Case |
|---|---|---|
| First Click | 100% to the first touchpoint | Awareness campaigns |
| Last Click | 100% to the final interaction | Direct response initiatives |
| Linear | Equal share across all touchpoints | Balanced multi-touch paths |
| Time Decay | Increasing weight as purchase nears | Momentum-driven launches |
This side-by-side view makes it easier to match your goals with the right credit assignment.
First Click And Last Click Scenarios
Picture a product launch teased on Facebook that drives 25% of total site visits. If you pick first click, that early Facebook ad grabs full credit. Switch to last click, and an Instagram story viewed moments before purchase claims the entire reward.
- Early Facebook ad sparks initial interest.
- Email follow-up nurtures the lead.
- Instagram story seals the sale.
Applying Linear And Time Decay Models
With linear attribution, each of those three steps earns an equal 33% share. Time decay might instead assign 20% to the Facebook ad, 30% to the email, and 50% to the Instagram story—because the closer a touchpoint is to conversion, the stronger its pull.
Tip Combine time decay with UTM variables for richer insight into each touchpoint’s performance.
Learn more in our guide on UTM Variables and Google Analytics for precise multi-touch attribution.
By testing different models side by side—ideally in a centralized dashboard like PostSyncer—you can see exactly how your ROI shifts when credit moves from one channel to another.
Best Practices For Attribution
No model will capture every nuance of human behavior, so keep your assumptions transparent and revisit them often.
- Establish UTM tagging standards for every campaign touchpoint to avoid gaps.
- Compare model outputs monthly and highlight gaps in reported ROI.
- Recalibrate credit rules as your audience’s habits evolve.
Centralizing your data in PostSyncer lets you flip between models instantly and spot which approach aligns closest with real-world results. Start by mapping your customer journey to identify every touchpoint. Then run at least two attribution models side by side, and tweak time decay weights based on your typical purchase cycle. This way, you protect budget for your highest-impact channels and maximize your social media return on investment.
Identifying Key Metrics And Data Sources
Choosing the right KPIs feels like picking the best tools for a job—you want the ones that fit your goals perfectly. Not every number tells the same story, so zero in on Cost per Acquisition, Engagement Rate, Revenue Attribution, and Customer Lifetime Value.
Each metric draws from its own data well:

- Cost per Acquisition shows total spend divided by new customers from ads or organic posts.
- Engagement Rate tracks likes, comments, and shares to gauge audience interest.
- Revenue Attribution assigns a dollar value to each touchpoint in the buyer’s journey.
- Customer Lifetime Value estimates the average revenue generated by a user over their entire relationship.
Think of Facebook and Instagram’s native analytics as a live traffic camera—spot engagement spikes in real time. Your CRM then acts like a detailed logbook of conversions and customer profiles. Finally, platforms such as Google Analytics tie social traffic back to on-site behavior and revenue outcomes.
Mapping Sources Into A Unified Dashboard
Data scattered across systems is like having puzzle pieces all over the table. Bringing them together on one screen gives you the complete picture.
PostSyncer connects native APIs, CRM feeds, and web analytics into a single dashboard that updates itself. That means you’ll notice shifts in Cost per Acquisition or drops in Engagement Rate at a glance.
| KPI | Data Source |
|---|---|
| Cost per Acquisition | Ad platform analytics |
| Engagement Rate | Social media insights |
| Revenue Attribution | CRM and Google Analytics |
| Customer Lifetime Value | CRM and sales reports |
In one case, a retailer cut CPA by 20% simply by centralizing Facebook and Google Ads data through PostSyncer. When your numbers all come from the same source, budget pivots happen in minutes—not days.
Demonstrating ROI With Real Results
Influencer and creator-led programs often deliver the biggest bang for your buck. In fact, they returned an average of $5.78 per $1 spent in 2025, thanks to measurable engagement lifts. Discover more insights about influencer program ROI on Sprinklr
Integrating those partnership stats into your main dashboard elevates them from footnotes to headline metrics. Treat your dashboard like a compass: clear data sources help you steer more budget toward top performers.
Key Takeaway Unified data sources prevent analysis paralysis and unlock consistent ROI insights.
Automate data refresh schedules so your team always works with the latest figures. This not only cuts manual errors but also frees up hours every week. Reviewing these metrics at set intervals helps you catch anomalies, validate tactics, and optimize spend in real time.
Best Practices For Reliable Data
Start by mapping out each data source, its update cadence, and who’s responsible. That transparency keeps everyone on the same page.
Leverage PostSyncer workflows to tag metrics by their freshness—filtering by platform or date becomes a breeze. With automated syncing and clear documentation, your social media ROI reporting will be rock-solid.
Finally, schedule quarterly audits as a tune-up for your system. As goals evolve and new campaigns launch, refining your KPIs ensures your metrics stay aligned with what really matters.
Practical Calculation Examples And Templates

Templates are your shortcut. Instead of wrestling with raw figures, you feed in numbers and instantly see actionable insights.
The kit offers three file types to match your workflow:
- An Excel workbook packed with dynamic dashboards and pivot tables.
- A Google Sheets version primed for real-time collaboration.
- A CSV template built for API imports into analytics platforms like PostSyncer.
Each file highlights input cells in yellow and tucks away rows of formula notes so you always know how the math works.
Imagine a mid-size retailer dropping their Q1 stats into the sheet and immediately spotting a 23% drop in cost‐per‐acquisition after testing new ad creatives. Seeing that result in seconds lets you pivot fast and double down on what’s working.
Integrating With PostSyncer
Instead of bouncing between spreadsheets and reporting tools, import your CSV directly into PostSyncer to visualize your data in real time.
- Connect your CSV as a data source.
- Map fields such as Ad Spend, Conversions, and Revenue to the dashboard.
- Schedule hourly refreshes to keep campaign spend and results up to date.
This approach wiped out manual data wrangling and slashed reporting time by 50% in one case.
Setting Up Your Data Sources
- List every metric you need: Ad Spend, Impressions, Clicks, Purchases.
- Track where each metric lives: platform analytics, CRM exports, or PostSyncer.
- Align date ranges across all data pulls to prevent mismatches.
“A well-defined data map is the backbone of accurate ROI calculation.”
For instance, in 2025 paid social advertising delivered average returns of about $5.28 for every $1 spent, reflecting rising spend on video and AI-personalized formats alongside stronger measurement approaches. Learn more about paid social ad returns in 2025 in this analysis on SQ Magazine.
ROI Calculation Example
Paid Campaign Example
- Ad spend: $10,000
- Revenue: $52,800
- ROI = (52,800 − 10,000) ÷ 10,000 = 4.28 (428%)
Organic Growth Initiative
- Production cost: $2,000
- Attributed revenue: $12,000
- ROI = (12,000 − 2,000) ÷ 2,000 = 5 (500%)
Influencer Partnership
- Fee: $5,000
- Conversions valued at $20,000
- ROI = (20,000 − 5,000) ÷ 5,000 = 3 (300%)
Template Structure Comparison
| Template Section | Purpose |
|---|---|
| Ad Spend | Input total dollars spent |
| Revenue | Capture sales or conversion value |
| Conversions | Count of successful actions |
| ROI Formula | (Revenue − Cost) ÷ Cost |
| ROAS Formula | Revenue ÷ Ad Spend |
Customizable Template Walkthrough
- Open the template in Excel or Google Sheets.
- Fill in the highlighted fields with your campaign numbers.
- Built-in formulas automatically calculate ROI and ROAS at a glance.
Tip Label each row with campaign names and dates to compare performance over time.
Use these simple formulas directly in your spreadsheet:=(Revenue - Cost) / Cost=Revenue / Ad_Spend
Export your finished sheets as PDF or CSV for stakeholder presentations. Use PostSyncer to centralize calculations across channels in a live dashboard. Adjust templates for platform-specific metrics like video views or swipe-ups.
Applying Templates To Multiple Platforms
- Facebook Ads: add CPC, CTR, and video completion metrics.
- YouTube Campaigns: factor in view-through rates and ad recall lift.
- TikTok Promotions: include engagement rate and hashtag challenge participation.
Adjust cost inputs for currency differences and campaign lengths.
Use separate tabs for each channel to keep data tidy and comparable.
With these examples and templates, measuring social media return on investment becomes both transparent and repeatable.
- Tip: Name each file with date stamps to track version history.
Tools Workflows And Best Practices For Social Media ROI
Centralizing your social data feels a lot like solving a jigsaw puzzle. Each platform’s API is one piece, and when they all click into place, you get a clear picture of performance.
With PostSyncer, you link Facebook, Instagram, LinkedIn, and your CRM in minutes and unlock real-time insights across every channel.
Once you flip the switch on those connectors, tracking ROI trends becomes as intuitive as monitoring your daily step count.
In practice, you’ll set up data pipelines, craft custom dashboards, and schedule alert triggers so you never miss a dip in performance.
Juggling multiple dashboards by hand? That’s like trying to keep apples and oranges from rolling off the table—you’ll overlook the small shifts hiding in plain sight.
Connecting Data Sources
To start, map each platform’s API into PostSyncer. Imagine merging several on-ramps onto one wide highway.
Then, normalize your figures so impressions, clicks, and conversions all share common definitions—no more guessing games.
Finally, schedule hourly or daily refreshes to keep your dataset fresh and decision-ready.
“By automating data ingestion, you avoid manual errors and speed up decision making.”
Key Connector Steps
- Complete OAuth or API key authentication for each channel
- Define which metrics to pull and how often
- Set refresh cadence and notification thresholds
The screenshot below shows a PostSyncer dashboard that aggregates spend and revenue by campaign.
This view flags a 15% rise in cost per acquisition after a creative tweak—an insight that sparked an immediate budget shift.
Building Custom Dashboards
Custom dashboards are your sandbox for mixing and matching metrics. Drag and drop widgets to compare CPA, ROAS, and engagement side by side.
Use filters to zero in on specific date ranges, platforms, or campaign labels. That way, you see exactly what matters most.
| Metric | Widget Type | Purpose |
|---|---|---|
| CPA | Gauge | Monitor cost efficiency |
| ROAS | Bar Chart | Compare ad spend performance |
| Engagement | Line Graph | Spot engagement trends |
Scheduling Alerts And Reports
Think of alerts as guardrails on a busy highway. They kick in the moment your metrics cross a threshold you care about.
- Define KPI limits for cost per acquisition and engagement rates
- Choose delivery channels like Slack, email, or SMS
- Apply escalation rules so critical issues ping decision-makers right away
One agency slashed manual monitoring by 60% with this workflow.
“Real-time alerts prevented a 10% overspend within minutes,” says a digital strategist.
Actionable Best Practices
- Run A/B tests on your ad creative. If a variant lifts CTR by 20%, double down quickly.
- Focus on high-value audiences with lookalike and custom segments.
- Experiment with attribution models—first click, last click, linear—and compare ROI swings.
- Automate budget reallocation when key metrics breach your thresholds.
Case Story Alpha
A retailer doubled ROAS to 4x by swapping image styles and watching results in PostSyncer.Case Story Beta
An agency cut CPA by 30% after pausing underperforming ads via scheduled alerts.
Key Takeaway: Pinpointing winners in real time lets you optimize spend and boost social media ROI.
Automate regular reports so stakeholders always see progress and pain points side by side. That transparency sharpens ROI accuracy.
By centralizing your workflows and applying these tactics, you’ll turn raw data into actionable insights and steadily elevate your returns.
FAQ On Social Media ROI
Marketers often wrestle with assigning a clear dollar value to each campaign effort. This FAQ tackles the most common questions, breaking down how to measure and boost social media return on investment.
Each answer points you toward practical steps you can put into action today.
Choosing The Right Attribution Model
Picking an attribution model begins with mapping out your customer journey. That roadmap shows every touchpoint—from that first spark of awareness to the final decision.
- For early-stage impact, First Click gives credit to the initial interaction.
- When your focus is on closing sales, Last Click awards the final touchpoint.
- To spread recognition evenly, a Linear or Time Decay model might work best.
“Align attribution with your core objective to avoid misallocating budget.”
- Identify and map each audience touchpoint.
- Match the model to your campaign goals.
- Compare projected outcomes against real conversions.
For example, a subscription box brand switched to time decay and discovered 40% of conversions came from email nurtures that previous models overlooked. They then reallocated 25% more budget to those sequences—and saw immediate gains.
Setting Reporting Frequency
How Often Should I Report ROI
- Weekly Snapshots help you catch early performance shifts.
- Monthly Reviews surface broader trends and emerging opportunities.
- Quarterly Analyses align your social spend with budget cycles and seasonality.
Can I Measure ROI For Organic Content
Assign a dollar value to actions like shares and comments. Then divide the total engagement value by production costs to estimate organic ROI.
An organic post that drives 200 shares valued at $800 against $250 in creation costs yields 220% ROI.
| Metric | Source | Purpose |
|---|---|---|
| Shares and Comments | Platform analytics | Estimate audience interest |
| Production Cost | Internal tracking | Quantify content investment |
| Lead Value | CRM reports | Map engagement to revenue |
Analyzing Organic ROI Metrics
Refining your organic ROI formula is part science, part art. Test different dollar assignments for likes versus shares. Survey new leads to validate your estimates. When audience behavior shifts, tweak your formula so your ROI stays accurate.
Tools For Small Teams
What Tools Work Best For Small Teams
Small teams need budget-friendly platforms with built-in connectors. PostSyncer centralizes analytics from multiple networks into one clean dashboard.
- Low-cost plans with essential features
- Drag-and-drop dashboards for instant insights
- Direct API integrations with CRM and ad platforms
- Automated alerts to catch cost spikes immediately
With PostSyncer, you’ll spot ROI improvements in days—not weeks. Start your free trial today.
Ready to unify your social media analytics and maximize ROI? Try PostSyncer.