


Trying to manage your social media without a proper analytics dashboard is like trying to fly a 747 with just a single speed gauge. You might know how fast you're going, but you have no clue about your altitude, fuel, or direction. You're flying completely blind.
This is where social media analytics dashboards come in. They're powerful tools that pull all your performance data from every network you're on into one clean, visual hub. They stop you from guessing and start telling you a clear story about your campaigns, your audience, and your brand's overall health.
So, What Are Social Media Analytics Dashboards, Really?

Think of a social media analytics dashboard as your strategic cockpit. It gathers all those vital instruments—data from Facebook, X, LinkedIn, and everywhere else—and puts them right in front of you. No more frantically jumping between different tabs for Facebook Insights, then X Analytics, then LinkedIn Page Analytics. Everything you need is in one place.
This unified view is a game-changer. It allows you to finally see the complete picture of how you're doing. You can easily compare results across platforms, spot trends you'd otherwise miss, and truly understand how your audience interacts with your brand as a whole. It's the difference between looking at individual trees and seeing the entire forest.
Moving Beyond Surface-Level Metrics
Too many marketers get hung up on "vanity metrics" like follower counts and likes. They feel good, sure, but they rarely tell you anything meaningful about your business. A solid dashboard forces you to dig deeper and uncover the why behind the numbers.
A great dashboard doesn't just report what happened. It gives you the context to understand why it happened and, more importantly, what you should do next. It transforms you from a reactive data-checker into a proactive strategist.
For instance, seeing a sudden spike in engagement is interesting. But a dashboard can show you that the spike came from a specific audience segment, that they were most active late at night, and that the engagement actually led to a dozen website clicks. That's the kind of detail you need to really sharpen your content strategy.
The Core Purpose of a Dashboard
At the end of the day, the goal is simple: make smarter, data-driven decisions with confidence. An effective social media analytics dashboard gives you the clarity to do exactly that by shedding light on a few key areas:
- Campaign Effectiveness: Stop guessing and start measuring the real ROI of your marketing. Track metrics that tie directly to business goals, like leads and sales.
- Audience Behavior: Get a deep understanding of who your audience is, what they're interested in, and how they behave online. This is how you create content that truly resonates.
- Brand Health: Keep an eye on brand sentiment and your share of voice. See how people perceive you and how you stack up against the competition.
By pulling all this data together and visualizing it, these dashboards cut through the noise. They arm you with the insights you need to navigate the often-chaotic world of social media. For a closer look at what separates the good from the great, check out our full guide on choosing the right social media analytics dashboard for your team.
The Anatomy of a Powerful Analytics Dashboard
So, what separates a great social media analytics dashboard from a merely good one? To really get it, we need to pop the hood and see what makes these tools tick. The best ones aren't just glorified spreadsheets; they're smart, intuitive command centers built to turn messy data into clear, actionable insights. A truly powerful dashboard stands on three core pillars that work in perfect harmony.
The first, and arguably most important, is seamless data aggregation. Think about it this way: trying to get a complete picture of your social media performance by logging into each platform individually is like trying to bake a cake by running to a dozen different stores for each ingredient. It’s a chaotic, time-sucking mess. A top-tier dashboard is your central pantry, automatically pulling in data from Facebook, Instagram, LinkedIn, X, and all your other channels into one clean, unified view.
No more manual data entry. No more spreadsheet headaches. This is the engine that drives everything else, allowing you to finally see the big picture and compare performance across platforms to figure out where your efforts are really paying off.
Customizable Reporting and Visualization
Let's be honest, raw data is just a wall of numbers. It’s overwhelming and, frankly, useless on its own. A powerful dashboard is a master translator, turning those complex figures into easy-to-understand visual stories through customizable reporting. This is where you get to build reports that actually matter to your business goals, whether you’re tracking sales from social, measuring brand awareness, or just keeping an eye on audience growth.
You're no longer stuck with rigid, one-size-fits-all templates. The ability to drag and drop the metrics you care about means every report is instantly relevant. A marketing manager might zero in on engagement rates and content performance, while the CEO might only need a high-level summary of ROI. That’s the magic of personalization.
The real power of a dashboard isn’t in how much data it can show you, but in its ability to show you the right data at the right time. Customization turns a noisy data dump into a focused strategic tool.
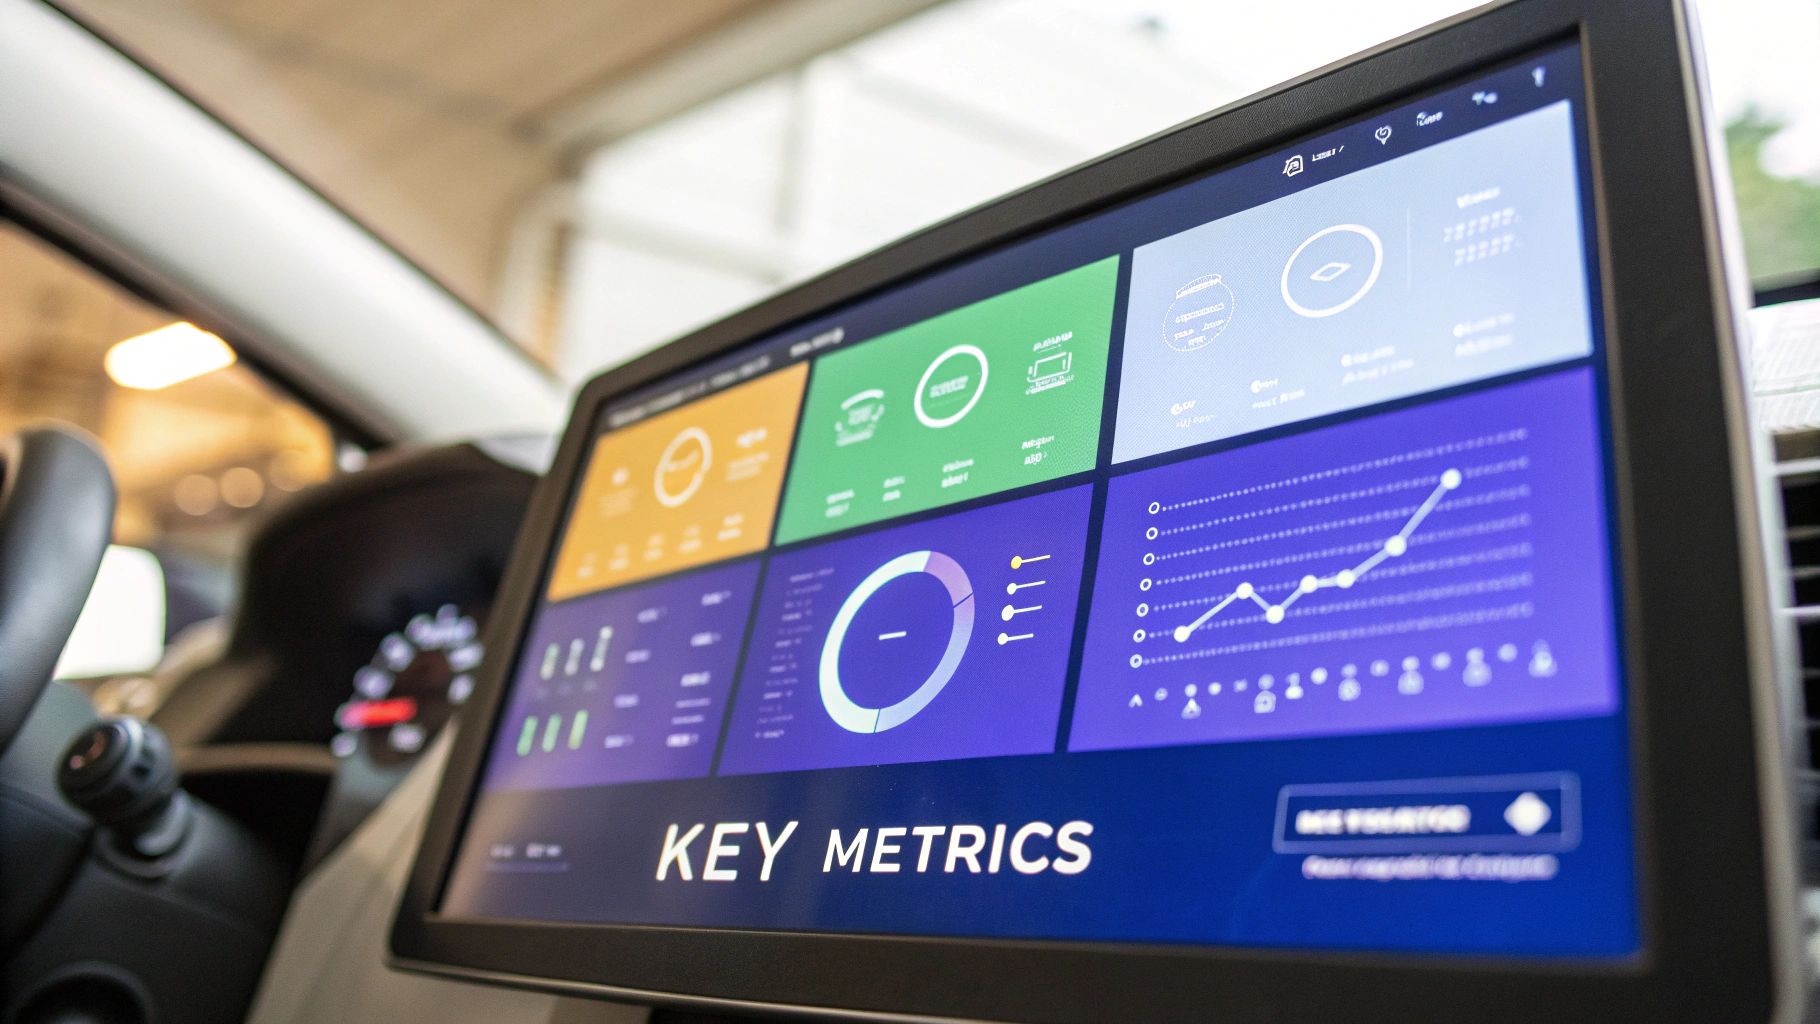
This is exactly what you see in action with a platform like PostSyncer. The visual layout immediately draws your attention to what’s important.
Notice how key metrics like follower growth and top-performing posts are laid out clearly. You don't have to hunt for the insights—they're right there, ready for you to act on.
Real-Time Monitoring and Alerts
Social media moves at the speed of light. A meme, a trend, or a customer complaint can blow up and disappear in the span of an afternoon. That's why real-time monitoring is an absolute must-have. It’s your eye in the sky, giving you an up-to-the-minute pulse on brand mentions, campaign performance, and industry chatter.
This constant feedback loop lets you be proactive instead of reactive. It’s the difference between steering the ship and just getting tossed around by the waves. Some key things real-time monitoring unlocks include:
- Brand Mention Tracking: Instantly see who’s talking about you. This allows you to jump on positive comments or quickly address a customer service issue before it snowballs.
- Trend Spotting: Catch viral topics and relevant hashtags as they start gaining steam, giving you a chance to join the conversation authentically.
- Crisis Management: Set up alerts for sudden spikes in negative sentiment. This early warning system can be the key to managing a potential PR fire before it gets out of control.
It’s no surprise that the demand for these capabilities is causing explosive market growth. The global social media analytics market, valued at around USD 14.0 billion in 2024, is projected to skyrocket to USD 83.11 billion by 2033. This surge is all about businesses realizing they need to listen and react to what customers are saying online. You can dig deeper into these numbers and the trends driving them in the full market research.
Focusing on Metrics That Actually Drive Growth

A social media analytics dashboard can throw hundreds of different data points at you. Without a clear focus, it's incredibly easy to get lost in a sea of numbers, chasing metrics that look impressive but don't actually move the needle for your business. This is the classic trap of prioritizing vanity metrics over actionable insights.
The key is to cut through the noise. You need to zero in on the data that directly reflects progress toward your real strategic goals.
Think of it like a fitness tracker. You could track a dozen different stats, but if your goal is to run a faster mile, your split times and heart rate matter way more than the total steps you took yesterday. It's the same with social media—your metrics must align with what matters most to your bottom line.
To make sense of it all, we can group the most impactful metrics into three core business categories: Engagement, Awareness, and Conversion. Each category tells a different part of your brand's story and helps you see your performance from a specific, strategic angle.
Engagement: The Pulse of Your Community
Engagement metrics are the lifeblood of your social media presence. They measure how actively your audience is interacting with your content, giving you a direct signal of its relevance and quality.
High engagement doesn't just mean people saw your content; it means they cared about it. These metrics go far beyond a simple "like" to tell you how compelling your stuff truly is. A high number of shares, for example, shows your content is so valuable that your audience is willing to vouch for it with their own followers.
Key engagement metrics to watch:
- Comments and Replies: This proves you’re starting a genuine conversation. High-quality comments are a goldmine for understanding customer pain points and feedback.
- Shares or Retweets: The ultimate form of organic endorsement. This is how you expand your reach to new audiences through sources they already trust.
- Click-Through Rate (CTR): This measures how many people who saw your post were compelled enough to click a link, proving your call-to-action worked.
- Video Watch Time: For video, this is far more telling than simple view counts. It reveals if your storytelling is actually holding your audience's attention.
Awareness: Expanding Your Digital Footprint
Awareness metrics tell you how far and wide your message is traveling. This category is all about reach and visibility—measuring the size of the audience you're successfully connecting with. If engagement is the quality of your interactions, awareness is the quantity of your audience.
Tracking awareness isn't just about celebrating big numbers. It's about understanding your brand's visibility in a crowded market and ensuring your message is reaching potential new customers.
For instance, a sudden spike in impressions—the total number of times your content was displayed—could signal that a post is hitting the right notes with the platform's algorithm. Another crucial one is share of voice, which compares your brand mentions to your competitors. This helps you benchmark your presence and see how you stack up.
Conversion: Turning Followers Into Customers
This is where your social media efforts connect directly to business results. Conversion metrics track the specific actions you want your audience to take, like making a purchase, signing up for a newsletter, or downloading a resource. They are the ultimate proof that your strategy is delivering a tangible return on investment.
Many businesses struggle to connect social activity to real-world outcomes, but this is where a powerful dashboard shines. By tracking these metrics, you can finally draw a straight line from a specific post or campaign to a new lead or sale.
Essential conversion metrics include:
- Conversion Rate: The percentage of users who clicked a link in your post and completed a desired action on your website (e.g., made a purchase).
- Cost Per Click (CPC): For paid campaigns, this shows how much you're spending to get a single user to your website, helping you optimize your ad budget.
- Lead Generation: The number of new leads captured directly from a social media campaign, often through a form fill or a gated content download.
To give you a clearer picture, let's break down how these metrics translate into real business value.
Essential Social Media Metrics and Their Business Impact
| Metric Category | Example Metrics | What It Tells You | Business Impact |
|---|---|---|---|
| Awareness | Impressions, Reach, Share of Voice | How many people are seeing your content and how your brand's visibility compares to competitors. | Informs brand recognition efforts, market positioning, and top-of-funnel marketing strategy. |
| Engagement | Likes, Comments, Shares, Click-Through Rate (CTR) | How well your content resonates with your audience and sparks interaction. | Guides content creation, improves audience relationships, and boosts organic reach via algorithms. |
| Conversion | Conversion Rate, Leads Generated, Cost Per Click | How effectively your social media efforts are driving direct business outcomes. | Directly measures ROI, helps optimize ad spend, and proves the value of social media marketing. |
By organizing your dashboard around these three pillars, you transform it from a cluttered data feed into a strategic command center. This focused approach ensures every piece of data you analyze helps you make smarter decisions that drive real, measurable growth.
You can find more details on how to select a platform that excels in these areas by exploring some of the best social media analytics tools available today.
From Data Overload to Strategic Advantage
A powerful dashboard does more than just throw your metrics into a few pretty charts. It fundamentally changes the way you think about and execute your social media strategy.
Think of it as the bridge between raw, messy data and smart, confident decision-making. Without it, you’re basically just collecting numbers for the sake of it. With it, you start seeing the real opportunities that can push your brand forward.
This leap from simply gathering data to taking meaningful action is what separates the brands that thrive from the ones just spinning their wheels. Instead of just reporting on what happened last month, a great dashboard tells you the story behind the numbers, turning abstract figures into a clear roadmap for what to do next.
Uncovering Deeper Customer Understanding
At its heart, social media is all about connection. An analytics dashboard gives you a powerful lens to see your audience not just as a follower count, but as real people with opinions, preferences, and problems you can solve.
It helps you move past basic demographics to truly understand customer sentiment on a massive scale.
By digging into comments, mentions, and the chatter surrounding your brand, you get an unfiltered look at what your community really thinks. Are they hyped about a new feature? Frustrated with a support issue? A dashboard like PostSyncer visualizes this sentiment, helping you spot patterns and put out fires before they get out of control. This kind of deep listening builds serious customer loyalty because people feel like you're actually paying attention.
A dashboard transforms audience data from a simple "who" into a rich "why." It helps you understand the motivations behind their clicks, comments, and shares, which is the key to creating content that truly connects.
Identifying and Acting on Market Trends
The social media world moves at lightning speed. Trends can explode and fizzle out before you’ve even had your morning coffee. Your analytics dashboard is your early-warning system, flagging emerging conversations and content formats before they hit the mainstream.
This isn't just about hopping on the latest viral meme (though you can do that too). It’s about spotting real shifts in consumer behavior and interests relevant to your industry.
For example, a brand using PostSyncer might see a sudden spike in conversations around "sustainable packaging" in their niche. This one insight is gold, allowing them to:
- Create Timely Content: Immediately start producing posts, videos, or articles that tap into this trending topic.
- Inform Product Development: Give the product team solid data on a growing customer desire.
- Adjust Ad Targeting: Tweak paid campaigns to reach audiences who are actively looking for eco-friendly products.
When you catch these trends early, you position your brand as a leader, not a follower scrambling to keep up. The demand for these real-time insights is why the global social media analytics market, valued at USD 10.23 billion in 2024, is projected to skyrocket to USD 43.25 billion by 2030. It's a clear sign of how vital this has become. You can dive deeper into these market dynamics in the full industry report on Grand View Research.
Optimizing Marketing Spend for Maximum ROI
Finally, let's talk about the money. One of the biggest wins from a great dashboard is the ability to tie your social media efforts directly to your bottom line. It gives you clear, undeniable proof of what’s working—and what’s just wasting your budget.
You can see exactly which platforms, campaigns, and even which types of content are driving the most traffic, leads, and sales. Armed with that knowledge, you can start making surgical decisions with your budget. Double down on what's killing it, and cut the dead weight.
This data-driven approach means every single dollar you spend is working as hard as it possibly can to hit your business goals.
How To Choose The Right Analytics Dashboard
Picking the right social media analytics dashboard can feel a lot like choosing a new car. They all promise to get you where you need to go, but the ride, features, and long-term value are worlds apart. With so many options flooding the market, it's easy to get lost in feature lists and slick demos.
The real key is to tune out the noise and zero in on what will actually help your business grow—not just today, but a year from now. A simple, practical framework helps you weigh your options and invest in a tool your team will actually use and love. It all starts with looking past the pretty charts and asking how a platform will really fit into your day-to-day work.
The best social media analytics dashboards feel like a natural extension of your marketing brain, not just another piece of software to juggle.
Aligning Features With Your Core Business Needs
Before you even glance at a pricing page, the first step is to get brutally honest about what you need. What problems are you actually trying to solve? Are you an e-commerce brand laser-focused on driving sales from social? Or a B2B company trying to build thought leadership and pull in qualified leads? Your goals will dictate the features you can't live without.
Start by making a simple checklist of your absolute must-haves. This list will be your north star as you sift through different platforms.
- Platform Integrations: Does the dashboard connect to all the social networks where you're active? Think beyond the big ones. If TikTok or Pinterest is where your audience lives, you need full-throttle support for them.
- Reporting Customization: Can you build reports that tell the story of your specific KPIs, or are you stuck with rigid, cookie-cutter templates? The power to create custom reports for different people—like your marketing team versus your CEO—is a total game-changer.
- User Interface (UI) and Experience (UX): Is the platform actually easy and intuitive to navigate? A clunky, confusing interface is the quickest way to make sure your shiny new tool collects digital dust. A clean, user-friendly design, like the one we built at PostSyncer, encourages everyone on your team to jump in and use it.
The image below breaks down a simple decision tree to help different team members figure out which metrics they should care about most when looking at a dashboard.
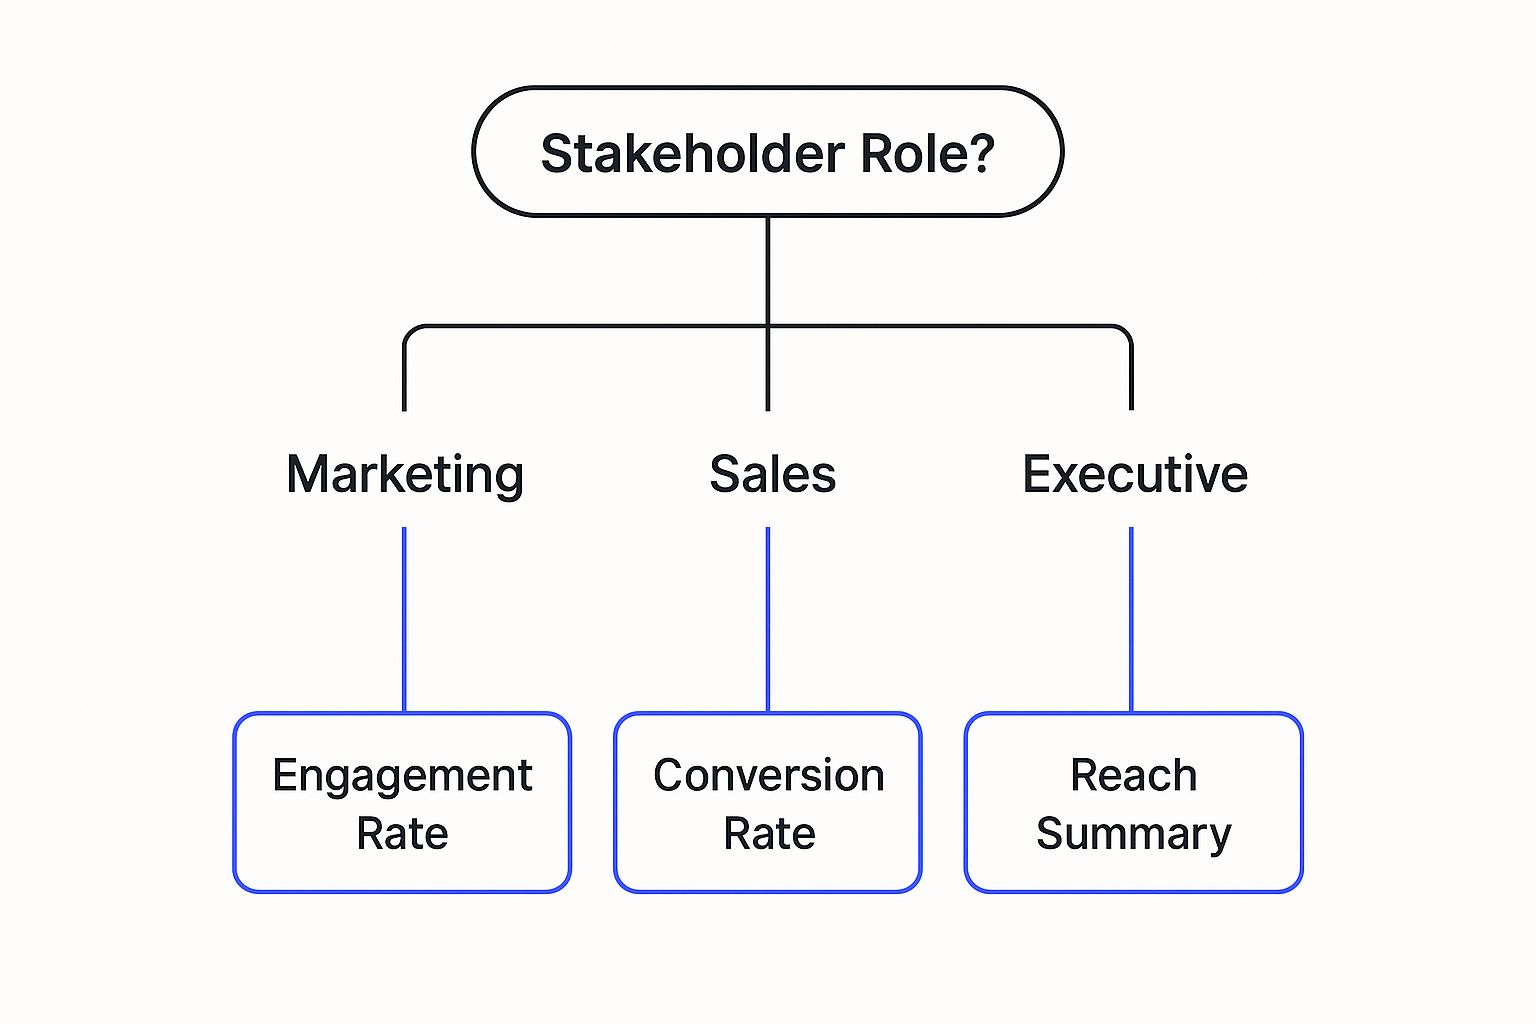
As you can see, a marketing manager might be obsessed with engagement rates, while a sales leader only cares about conversions. This just drives home why you need a dashboard that’s flexible enough for everyone.
Future-Proofing Your Investment
Your business isn’t standing still, and your analytics tool shouldn't either. Scalability is a huge factor that often gets overlooked in the excitement of a demo. Will the dashboard grow with you as you launch on new social channels, bring on more team members, or just handle a bigger flood of data? As you explore options, look for dashboards that are great at managing multiple social media accounts effectively, since this will make your life a whole lot easier as you expand.
Choosing an analytics dashboard is a long-term partnership. You're not just buying a piece of software; you're investing in a platform that needs to support your strategic growth for years to come.
This is also where more advanced features start to matter. Don't be afraid to ask about things like AI-powered sentiment analysis or trend forecasting. These aren't just buzzwords; they represent the ability to turn a mountain of data into genuinely useful, predictive insights that can keep you ahead of the competition.
Finally, think about the people behind the software. What’s the customer support like? When you hit a snag or have a question, how quickly and helpfully can you get an answer? Look for platforms that offer solid onboarding, great help docs, and easy-to-reach support channels. A great tool with terrible support quickly becomes a massive headache.
To make this process easier, we've put together a quick checklist to guide your decision.
Dashboard Selection Criteria Checklist
Use this table to compare potential dashboards side-by-side. It’s designed to help you look beyond the marketing fluff and evaluate the features that will genuinely impact your team’s success.
| Feature/Criterion | Why It Matters | What to Look For | PostSyncer Advantage |
|---|---|---|---|
| Comprehensive Platform Integrations | Your data is useless if it's incomplete. You need a full picture of your presence across all relevant channels. | Support for all your current and planned social networks (e.g., Instagram, Facebook, TikTok, LinkedIn, Pinterest). | PostSyncer connects seamlessly with all major platforms, providing a unified view without any data gaps. |
| Customizable Reporting & Dashboards | One-size-fits-all reports don't speak to specific goals. Tailored reports make data relevant to different stakeholders. | Drag-and-drop report builders, custom metric widgets, and export options (PDF, CSV). | Our dashboard is fully customizable, allowing you to build and share reports that focus on the KPIs that matter most to your business. |
| Intuitive User Interface (UI/UX) | If the tool is hard to use, your team won't use it. A clean design promotes adoption and daily use. | A clear navigation, logical layout, and minimal clicks to find key information. No steep learning curve. | We pride ourselves on a clean, intuitive interface designed for marketers, not data scientists. Get insights fast, without the clutter. |
| Scalability and Growth Potential | Your tool should grow with your business, not hold it back. | Plans that accommodate more users, social profiles, and data volume over time without a massive price jump. | PostSyncer offers flexible, affordable plans that scale with you, whether you're a startup or a growing agency. |
| Advanced Analytics Capabilities | Basic metrics are good, but deep insights drive strategy. | Features like sentiment analysis, competitive benchmarking, and trend identification. | We provide advanced analytics that go beyond surface-level numbers, helping you understand the "why" behind your performance. |
| Responsive Customer Support | When you need help, you need it now. Good support saves time and frustration. | Multiple support channels (chat, email, phone), detailed knowledge base, and fast response times. | Our dedicated support team is here to help you succeed with quick, expert assistance and comprehensive onboarding. |
By carefully weighing these criteria, you can move past the hype and choose a social media analytics dashboard that truly empowers your team. For more guidance on this, don't forget to check out our complete guide on social media analytics and reporting.
Alright, let's get that data talking.
Turning a mountain of raw data into actual wisdom is where social media analytics dashboards really shine. It’s time to stop talking theory and start building your first report. Don't worry, this is way more intuitive than you might think. We're not getting lost in spreadsheets here; we're setting up a clean, customized view that tells you what you need to know, fast.
First things first, you need to connect your social media accounts. A good platform like PostSyncer makes this dead simple, walking you through a secure sign-in for each network. In just a few minutes, the dashboard will start pulling in your data, both old and new, laying the groundwork for everything to come. Think of it like plugging all your instruments into the soundboard before a concert—once everything's connected, you can start mixing.
With your accounts linked up, the next critical step is deciding what success actually looks like for your brand by choosing your Key Performance Indicators (KPIs).
Defining Your Core Metrics
Whatever you do, don't just track everything. A high-impact report is focused, zeroing in on the metrics that tie directly back to your business goals. Is your main goal to build brand awareness? Then Reach and Impressions are your north stars. If you’re trying to drive traffic to your website, your report absolutely must highlight Click-Through Rate (CTR) and Website Clicks.
Here’s a quick way to think about it:
- Boosting Community Engagement? Prioritize metrics like comments, shares, and the overall engagement rate.
- Driving Conversions? Your report should be all about lead generation, conversion rates, and that sweet social media ROI.
- Growing Your Audience? Keep a close eye on follower growth, audience demographics, and how your share of voice stacks up against competitors.
Choosing these KPIs upfront makes your report a sharp, strategic tool instead of a distracting data dump.
Customizing Your Dashboard for Clarity
The final piece of the puzzle is arranging these KPIs into a visual dashboard that gives you clarity at a single glance. The best social media analytics dashboards, including PostSyncer, offer drag-and-drop customization. This feature is huge because it lets you put your most important metrics front and center, so the first thing you see is the data that matters most.
This screenshot from PostSyncer’s setup guide shows just how easy it is to set up different widgets for each metric you’re tracking.
A smart layout allows you to tell a story with your data. You can place awareness metrics at the top, follow them with engagement stats, and finish with conversion data at the bottom—perfectly mirroring your customer's journey.
A well-customized report doesn't just show you data; it tells a story. It should guide your eyes from the big picture of your reach all the way down to the specific actions that bring in revenue, making strategic decisions feel completely natural.
By connecting your accounts, defining your most important KPIs, and arranging them in a logical flow, you can build your first report in less than an hour. This gets you making data-backed decisions right away, without any steep learning curve, and turns your social media strategy from guesswork into a precise, growth-driving machine.
Frequently Asked Questions
Jumping into the world of social media analytics can bring up a few questions. It's totally normal. To clear things up, we've put together answers to some of the most common things people ask when they're looking at different tools.
How Much Do Analytics Dashboards Cost?
This is the big one, right? The price for social media analytics dashboards is all over the map, which is actually a good thing—it means there’s a fit for just about any budget.
Free or Freemium Plans: A lot of platforms have a free tier that’s perfect if you're a solo creator or just dipping your toes in the water. They'll usually limit how many social profiles you can connect or how far back you can look at your data.
Entry-Level Paid Plans: For small teams, you’re typically looking at plans in the $20 to $100 per month range. This is where you start to unlock more profiles, get deeper insights, and access basic reporting.
Professional and Agency Plans: Once you get into the $100 to $500+ per month zone, you're in territory built for growing businesses and marketing agencies. These plans come with the heavy hitters: competitive analysis, white-label reporting, and tools for team collaboration.
How Long Does It Take To Set Up a Dashboard?
You'll be glad to hear this: getting started is usually quicker than you think. For most modern tools, you can go from zero to a fully running dashboard in under an hour.
The process is pretty simple. You sign up, connect your social media accounts through a secure, straightforward authorization, and let the tool pull in your data. Customizing your main dashboard to show the KPIs you care about most is often just a simple drag-and-drop.
A well-designed dashboard is all about getting you to insights, fast. You shouldn't need a technical degree just to connect your accounts and see what's going on. A good platform makes the whole onboarding experience smooth and painless.
How Accurate Is the Data in These Dashboards?
Data accuracy is everything, and any reputable analytics dashboard takes it seriously. These tools pull their information directly from each social network’s official Application Programming Interface (API). Think of it as a direct, secure pipeline.
This means the numbers you see for reach, impressions, and follower counts are the very same numbers the platforms themselves are reporting. On occasion, you might see tiny differences, but that's usually because platforms define metrics slightly differently or update their data feeds at different intervals. A quality tool will always be transparent about its data sources, so you can trust the numbers guiding your big decisions.
Ready to turn your social media data from just numbers into a real strategic advantage? PostSyncer gives you a powerful, intuitive, and affordable way to track performance, understand your audience, and drive real growth. Start your free 7-day trial today and see the difference for yourself.